
From Plant Room to Board Room: Bridging the Sustainability Data Gap
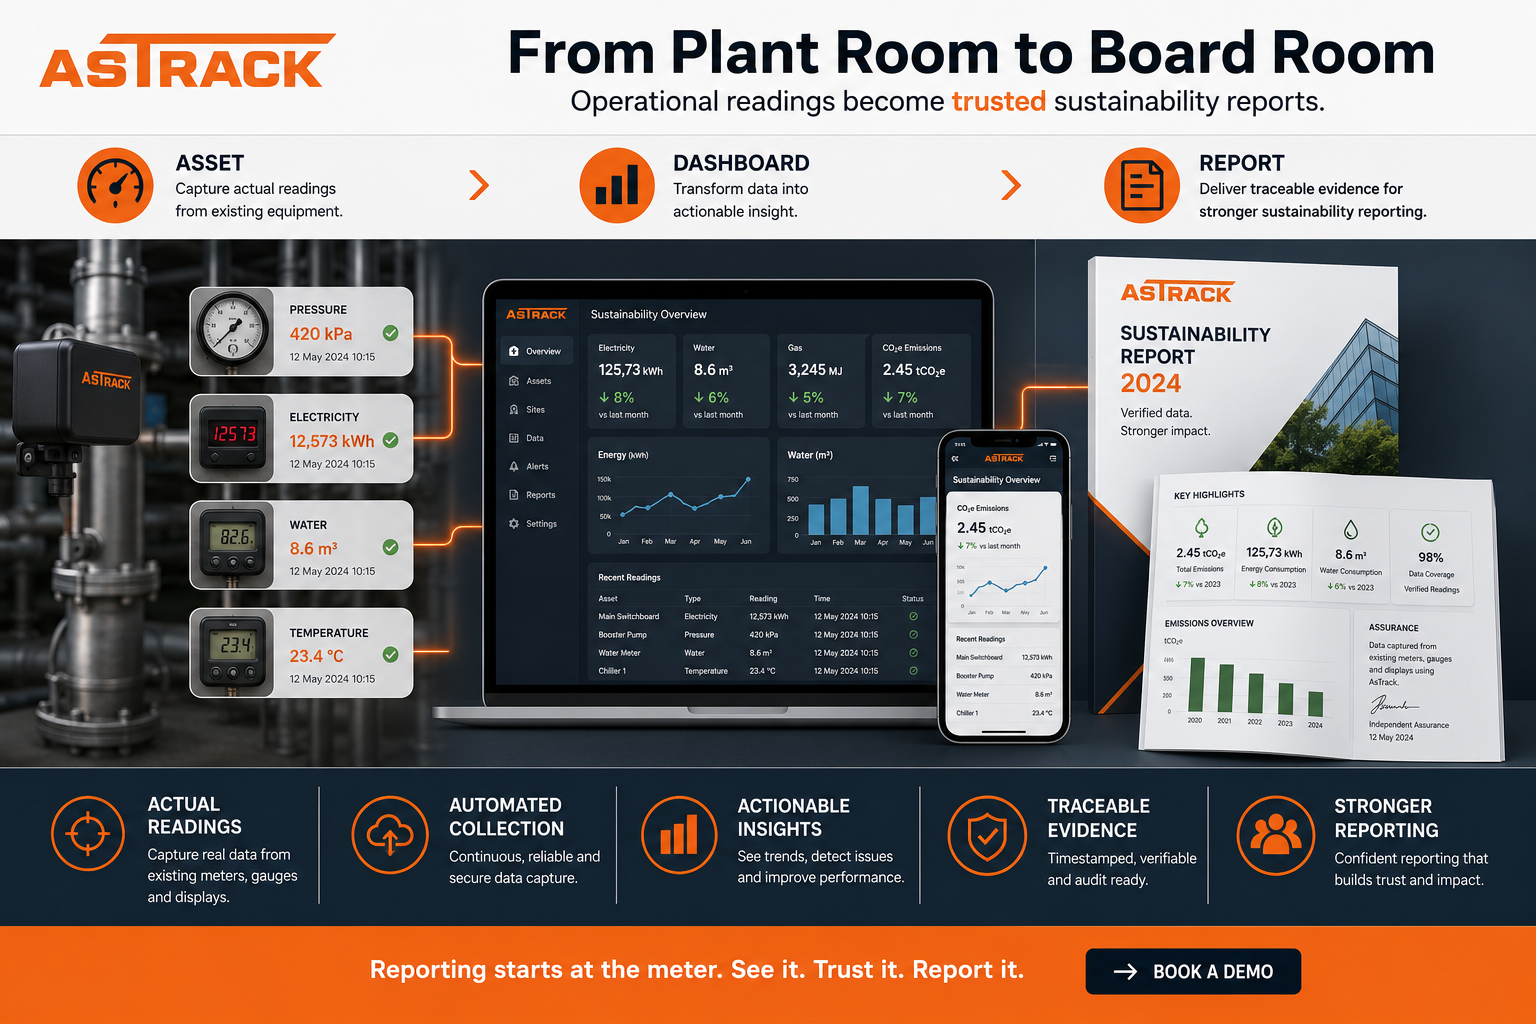
Sustainability is no longer a peripheral concern for the marketing department; it is a core financial and operational mandate. However, for many enterprise organizations, a significant gap exists between the physical reality of their infrastructure and the high-level figures presented in an annual ESG report.
At AsTrack, we call this the journey from the plant room to the board room. Closing this gap requires more than just spreadsheets, it requires an intelligent pipeline that turns raw electrical load and thermal output into actionable executive intelligence.
Phase 1: The Pulse of the Plant Room
The journey begins in the basement. Within the plant room, chillers, boilers, and AHUs (Air Handling Units) represent the heavy lifting of enterprise infrastructure. These assets are the primary consumers of energy and the primary source of operational carbon.
Traditionally, these machines operated in a silo. A technician might check a gauge once a month, or a BMS (Building Management System) might store data locally where it is eventually overwritten. To achieve "Intelligent Infrastructure," we move beyond manual checks by implementing continuous IoT monitoring.
-
Granular Metrics: Power draw, cycle frequency, and flow rates.
-
Condition Monitoring: Identifying inefficiencies (like a misaligned pump) that cause an invisible spike in carbon intensity.
Phase 2: Transmutation in the Digital Layer
Raw data is noise; context is signal. Once AsTrack ingests the pulse of the plant room, the data undergoes a process of normalisation and enrichment. This is where a kilowatt-hour reading becomes more than a number.
Normalisation
Environmental variables must be accounted for. For instance, a rise in HVAC energy consumption isn't necessarily a sign of failure if the external temperature rose by ten degrees. Our platform correlates operational data with external telemetry to provide a true efficiency score.
Translation
During this stage, technical metrics are translated into the language of the business. We map energy consumption against specific cost centers, production lines, or square meters. This allows operational managers to see exactly which assets are driving the lion's share of the utility bill.
Phase 3: The Executive Dashboard
As the data moves up the organisational hierarchy, the level of abstraction increases. An Operations Director doesn't need to see the vibration frequency of a single motor; they need to see the aggregated performance of a regional data center cluster.
AsTrack’s dashboards serves three primary functions at this level:
- Benchmarking: Comparing the performance of Tier 1 facilities against historical baselines and industry standards.
- Anomaly Detection: Highlighting assets that are trending toward non-compliance or excessive waste before they impact the bottom line.
- Predictive Forecasting: Using current operational trends to project year-end carbon footprints.
Phase 4: The Annual Report and ESG Compliance
The final destination is the board room. Here, data must be defensible, auditable, and aligned with global standards like CSRD, GRI, or TCFD.
When a CEO signs off on a sustainability report, they are making a public commitment. Relying on estimated data or manual spreadsheet entries introduces unacceptable risk. By sourcing data directly from the plant room, AsTrack provides a "single source of truth."
- Audit Trails: Every figure in the annual report can be traced back to the specific sensor and timestamp it originated from.
- Automated Reporting: Removing the manual labor of data collection significantly reduces the lead time for quarterly and annual disclosures.
Conclusion: Intelligence is the Key to Impact
The transformation of a mechanical vibration in a basement into a strategic pilar in a board room is the hallmark of a mature enterprise. By connecting the most granular levels of your infrastructure to your highest-level goals, you do more than just report on sustainability - you gain the power to manage it.
Intelligent Infrastructure isn't just about keeping the lights on; it’s about ensuring that every watt used is accounted for, optimised, and aligned with the future of the planet and the prosperity of the business.
Frequently asked questions
- What are the common challenges with traditional plant room data collection?
- Traditionally, machines operated in silos where data was stored locally and eventually overwritten, or technicians relied on manual monthly gauge checks. This lack of continuous monitoring creates a gap between physical infrastructure reality and high-level ESG reporting.
- How does AsTrack normalize raw energy data from HVAC systems?
- The platform correlates raw operational metrics with external telemetry, such as environmental temperature changes. This context allows the system to determine if a rise in energy consumption is a sign of equipment failure or an expected response to external weather variables.
- What high-level functions do executive sustainability dashboards provide?
- Executive dashboards provide benchmarking against historical baselines, anomaly detection for assets trending toward non-compliance, and predictive forecasting for year-end carbon footprints. These tools help leaders manage aggregated performance rather than individual technical metrics.
- How can companies reduce risk in their annual ESG reporting?
- Companies can reduce risk by sourcing defensible, auditable data directly from plant room sensors rather than relying on manual spreadsheet entries. This creates a single source of truth where every figure in a report can be traced back to a specific timestamp and sensor.