
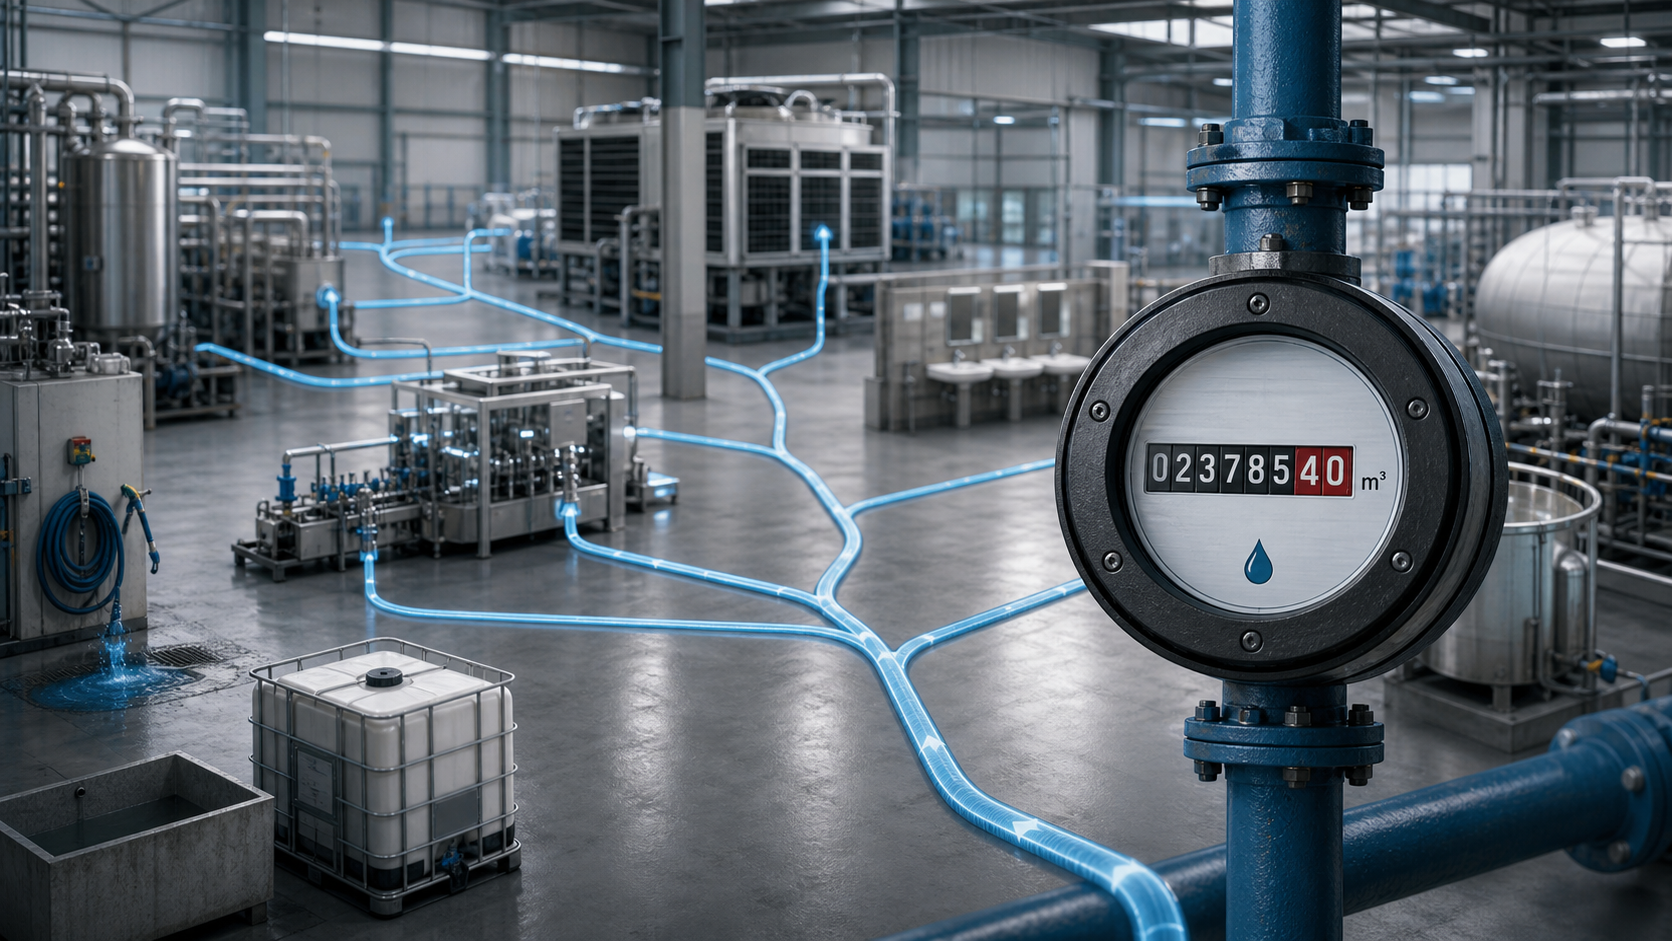
A single figure on a dashboard can be a comforting thing. When total energy consumption, water usage, or output volume stays within expected parameters, it is easy to assume everything is functioning as intended. However, reliance on high-level totals is one of the most common risks in industrial operations.
Total values represent the destination, but they tell you nothing about the journey. Without visibility into the individual readings that make up those totals, you are operating on a foundation of guesswork.
The danger of the invisible average
Aggregated data often hides outliers. A facility might show stable total power consumption, but that total could be composed of one machine running significantly under-capacity while another is overheating and drawing excessive current.
When you only look at the total, these two anomalies cancel each other out on the spreadsheet. The result is a false sense of security. You remain unaware of a pending motor failure and a production bottleneck because the "bottom line" looks healthy. By the time the total is affected enough to trigger an alarm, the underlying asset is often already damaged.
Data provenance and the audit trail
In high-stakes environments, a number is only as good as its history. If a regulator or a senior stakeholder asks exactly where a figure came from, "it is the sum of our spreadsheet" is rarely an acceptable answer.
True operational oversight requires an unbroken chain of data. You need to be able to trace a monthly total back to specific weeks, days, and individual equipment readings. This is where many operations fall down, as their data is scattered across:
- Handwritten clipboards from manual rounds.
- Isolated BMS platforms that do not talk to each other.
- Sensors that log locally but are not networked.
- Legacy spreadsheets with broken macros or manual entry errors.
When data is disconnected, the process of verifying a total becomes a forensic exercise that takes days instead of seconds.
Breaking down the silos
To move beyond the total, you must bridge the gap between different data sources. Most facilities have three distinct ways that data enters the ecosystem.
First, there is the manual element. Technicians walking the floor with clipboards are capturing vital context that sensors often miss, such as a strange vibration or a minor leak. Second, there is the automated data coming from modern IoT sensors and smart meters. Third, there is the integrated data residing in existing building management systems or SCADA platforms.
The problem is not a lack of data; it is that these three streams rarely meet in one place. AsTrack functions as the single platform where every reading, regardless of its source, is unified. Whether you SCAN a QR code on a pump, AUTOMATE a vibration sensor, or INTEGRATE a legacy BMS, every individual data point is preserved.
Identifying the root cause
When a total does eventually shift, you need to know why immediately. If your total water consumption spikes, you need to be able to drill down instantly to see if the increase is distributed across the site or isolated to a single cooling tower.
Without granular data, the search for a root cause is a manual hunt through the facility. With every reading captured on one platform, you can filter by asset, location, or time to identify the source of the deviation in real-time. This turns reactive firefighting into proactive maintenance.
Moving to one platform
The goal of operational data is not just to report what happened, but to understand how it happened. Relying on disconnected totals leaves you vulnerable to hidden inefficiencies and sudden equipment failure.
By unifying your manual rounds, automated sensors, and existing software integrations, you gain a transparent view of your entire operation. You no longer have to ask where a number came from, because every reading is accounted for, timestamped, and visible in one place. Stop measuring just the total and start managing the details that drive it.
Frequently asked questions
- What is the danger of relying on high-level total energy values?
- Total values can hide outliers, such as one machine overheating while another is under-capacity, which cancels out anomalies and creates a false sense of security. Relying solely on totals often means equipment damage is already done by the time a total-level alarm is triggered.
- Why is data provenance important for industrial operations?
- Data provenance provides an unbroken chain of history needed for regulatory compliance and stakeholder audits. It allows operators to trace monthly totals back to specific days and individual equipment readings rather than relying on unverified spreadsheet sums.
- What are the primary sources of disconnected data in a facility?
- Data typically resides in three silos: manual technician rounds recorded on clipboards, automated IoT sensors or smart meters, and integrated data within existing BMS or SCADA platforms. Inefficiency occurs when these three streams do not meet in a single unified platform.
- How does granular data help with root cause analysis?
- Granular data allows operators to drill down instantly to see if a spike in consumption is site-wide or isolated to a specific asset. By filtering by location or time on a unified platform, reactive firefighting is replaced by proactive maintenance.